Our economy is data-driven. We have limitless data points at our disposal and every business is using them. Without using the power of big data, it’s almost impossible to succeed and grow in our fast-paced, highly competitive market.
So, how does this all translate to the way we handle and utilize data in everyday business?
Just like any other task, data collection and analysis are delegated to a special team. This team is usually comprised of engineers, mathematicians and scientists, while in recent years, study programs dealing specifically with data science have appeared.
And just like any other corporate department, data experts have to communicate their results and findings to others. Given that data analysis is a form of specialized science, it’s important to present it in a clear way to others who are less versed in it.
In this article, you can find info on how to present data findings to other departments and bridge the gap between business and technology.
1-Get Down to Brass Tacks
When it comes to presenting data findings to businesspeople, make sure you get down to brass tacks – present insights only and focus only on those findings that they will find useful or informative. Of course, in order to do this, you will have to know the operational and managerial priorities to not what interests them data-wise.
As a data analysis expert, there’s also no need to include your process in the report – it will only confuse non-experts and take the focus away from the central points.
Be very clear and understand what your business colleagues expect from your data findings. You can use feedback that you received on some of your recent meetings or ask them directly. If you’re unsure of whether your presentations are relevant enough for your colleagues, you can hold a quick Q&A session after your presentation to check.
Your data findings should be precisely in line with your company’s business objectives, so make sure you’re on the same page about the sales targets, KPIs, goals and other metrics. When you present data findings in a business meeting, your report should contain all of this information – and not much beyond that.
Your colleagues from the business department don’t necessarily need to know everything you came across, but they will definitely be curious about sales, profits, growth rates and other important business indicators.

Image source: SmartData Collective
2-Visualization and Imaging
There’s a good reason why visual presentations and predominant in data analysis meetings. Humans are highly visual beings. Images allow us to comprehend the meaning of data better and faster and spot anomalies more easily.
Let’s take a look at this example. Imagine if someone presented you with this content:
In 2018, Google Chrome was the leader in browser market share, with 40.88% of users, followed by Safari with 27.26%. Firefox was the third most-used browser with 9.39% of the market share, followed by Internet Explorer’s 8.22%.
The same data is presented in this chart:
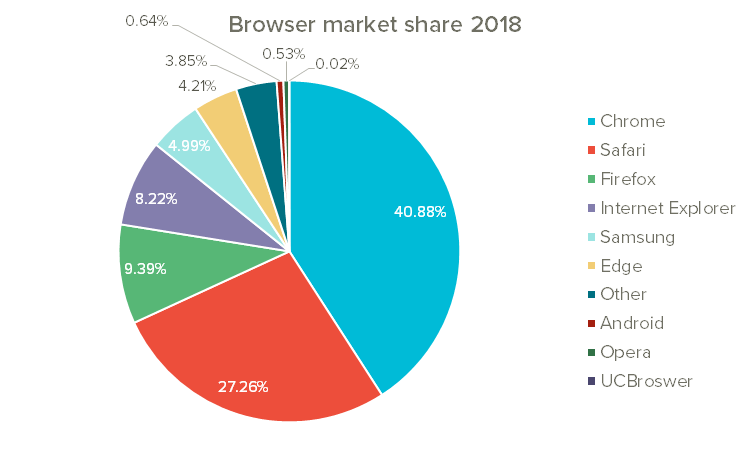
Image source: UpTrends
How long did it take you to read and comprehend the text above, and how long for the image (diagram)?
Remember, a picture is worth a thousand words!
“In all areas of business, whenever you’re dealing with something you have to present to non-experts, the best way to go about it is to turn it into images. This can help them understand the content much more easily and quickly than they would through verbal means. Resort to visualization as soon as you come across something that’s tricky to put into words”, says Melanie Sovann, a writer at Supreme Dissertations.
3-Perfectly Clear Texts
Of course, next to visuals, your presentations and reports will always have to contain text sections. This is where your ability or inability to bridge the language gap between tech and business jargon will be shown the most.
Before you decide on the final version of the report, write a draft. Make sure enough time passes so that you can have a read with a “fresh look”. After a day or two, grab your initial draft and read through it again, but first, act as if you’re a person reading it for the first time.
- Is everything simple and straightforward?
- Are you using jargon that a non-data scientist might not understand?
- Are you using long and complex sentences?
- Is the syntax clear and non-ambiugous?
If you’re not good with words and crafting text, a smart idea would be to hire a professional to do it for you. This way, you’ll be guaranteed a high-quality, professional result that will both verbalize your data and make it clear for readers.
If you don’t know where to find professional writers who can summarize and present your data, try some of these platforms: TrustMyPaper (a web portal of writing experts who can verbalize your data in an effective way), Upwork (a freelancer platform where you can hire writers who can extract info from data), WritingJudge (a website that reviews and ranks top writing services) or iWriter (where you can hire freelance writers for data reports).
4-Develop Soft Skills
“Just like an employee in any other department, you are primarily valued for your specific set of skills, but it’s highly appreciated if your abilities go beyond your expertise: the ability to read a room, communication skills, punctuality, attention to detail, presentation… As a data scientist, even though your job entails dealing with numbers and figures, you will still be working with people”, says Kylie Brownes, a writer at IsAccurate and WowGrade.
Here are some of the most important soft skills that you can work on as a data analysis expert to better bridge the gap between technology and business:
- Organization skills – setting apart the relevant from the irrelevant is crucial for creating professional and useful data reports
- Prioritizing and delegating tasks – don’t be afraid to delegate some of your work to younger colleagues. You need to set clear guidelines on what’s your top task, and what’s not. In line with that…
- Time management – taking out too much time for irrelevant analysis and running behind on important stuff simply can’t happen when you’re preparing data reports
- Presentation skills – if you’re a senior member of your team (or the only employee managing data), you will also be the one presenting your findings
- Communication skills – as a data expert, you will often have to reach out to colleagues from other departments for information. Having the ability to communicate in a friendly and constructive way will make your work-life much easier.
Conclusion
Technology and business are definitely not enemies, and although they mostly speak a different language, it’s possible to bridge the gap with the help of an expert. One of the primary mediators in this space (today and in the future) will be the data scientist.
As a person who’s an expert in technology, but has to work and present to the business department, the data scientist might be the pioneer of those positions and professions that bridge the gap between science and business.